Week 11 | Session 1: Supply Chain Digital Twin — Introduction, Types, Components & Use Cases
Course: Supply Chain Digitization — Module 4: Digital Infrastructure
Session Agenda
Section titled “Session Agenda”1. What is a Digital Twin?
Section titled “1. What is a Digital Twin?”Definition: a virtual representation of a physical object, system or process that mimics the real-world entity in terms of its:
- Attributes — properties and characteristics
- Behaviour — how it responds to inputs and conditions
- Interactions — how it connects with other elements in the system
Created using: data from sensors, IoT devices and other sources + advanced modelling and simulation techniques.
2. Types of Digital Twins — Complexity Pyramid
Section titled “2. Types of Digital Twins — Complexity Pyramid”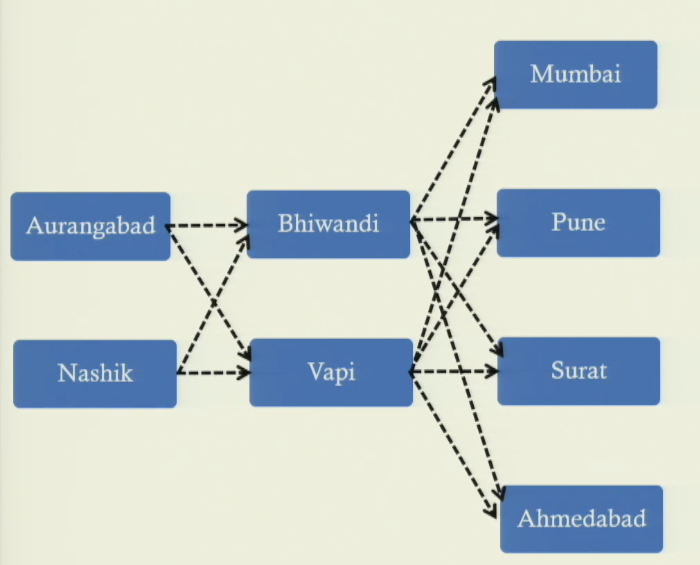
Complexity increases as we move up the pyramid — from product level to network of networks:
| Level | DT Type & Example | Complexity |
|---|---|---|
| 1 — Product | Digital twin of an aircraft engine → monitor engine performance in real time | Lowest |
| 2 — Process | Digital twin of an oil & gas refining process → optimize parameters, predict equipment failure | Low |
| 3 — Company / Enterprise | Digital twin of a manufacturing company → optimize production schedules, monitor equipment health | Medium |
| 4 — SC Network | Digital twin of a food & beverage SC → optimize sourcing, manufacturing, distribution; ensure quality, traceability | High |
| 5 — Network of Networks | Interconnected system of multiple supply chains — each with own suppliers, manufacturers, distributors, customers | Highest |
Most SC management digital twins operate at levels 3–5 (company, SC network, network of networks).
3. Data Sources — What Feeds Each Level of DT
Section titled “3. Data Sources — What Feeds Each Level of DT”Without data there is no digital twin. Different levels require different IT systems:
| DT Level | Data Source / IT System |
|---|---|
| Product level | CAD (Computer Aided Design), CAM (Computer Aided Manufacturing) |
| Process level | MES — Manufacturing Execution System |
| Company level | ERP — Enterprise Resource Planning |
| SC Network level | Specialized logistics software (e.g., AnyLogistix) + external: logistics providers, weather data, financial market data |
4. Enabling Technologies for Digital Twin
Section titled “4. Enabling Technologies for Digital Twin”Four core technologies connect the physical system to the digital system:
| Technology | Role in Digital Twin |
|---|---|
| IoT Sensors | Collect data from physical entities (temperature, location, vibration, etc.) and pass it to the DT in real time |
| Blockchain | Connect and trace parts, components and products across the SC — secure, tamper-proof traceability |
| AI & ML | Provide the decision support engine — optimization algorithms, demand forecasting, prescriptive analytics |
| Cloud | Store and process vast amounts of data from multiple sources; enable high-compute AI/ML to run at scale |
5. Three Components of a Supply Chain Digital Twin
Section titled “5. Three Components of a Supply Chain Digital Twin”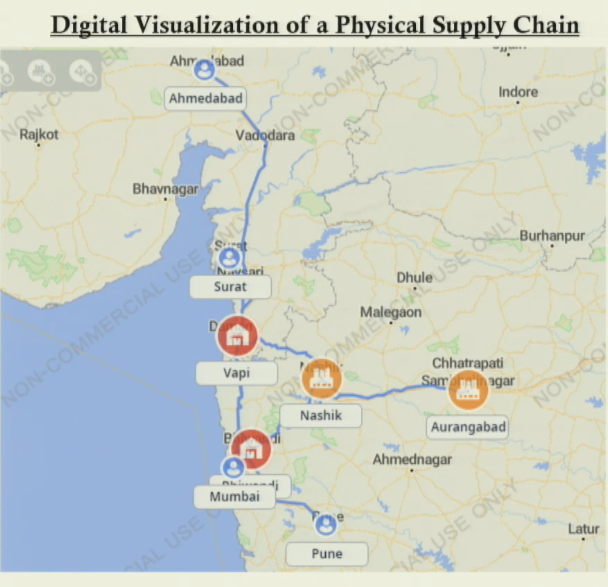
A SC digital twin is a virtual system comprised of three interconnected components:
| DT Component | What it Provides |
|---|---|
| Digital Visualization | Geographic map showing exact locations of factories, DCs, customers. Routes between nodes. Product flow visibility. |
| Digital Technologies | IoT, Blockchain, ERP, Cloud — connect the physical SC with the digital SC and generate the data stream. |
| Decision Making Support (Analytics) | Descriptive (what happened) + Predictive (what will happen) + Prescriptive (what to do) — all embedded in the DT. |
Digital Visualization — What it Looks Like
Section titled “Digital Visualization — What it Looks Like”Example: 2 factories (Aurangabad, Nashik) + 2 DCs (VAPI, V1D) + 4 customers (Mumbai, Pune, Surat, Ahmedabad). Each node plotted on a map using exact latitude and longitude. Routes between nodes also shown — full visual of product flow from factory → DC → customer.
6. Decision Support — Three Levels of Analytics in a DT
Section titled “6. Decision Support — Three Levels of Analytics in a DT”The analytics layer is what separates a digital twin from a simple visualization tool:
| Analytics Type | What it Does | SC Example |
|---|---|---|
| Descriptive (What happened?) | Analyses historical data to understand past performance | Product C sales were high in last 3 years. Factory A utilization was 85%. |
| Predictive (What will happen?) | Uses historical patterns to forecast future outcomes | Demand forecasting shows Product C demand will rise 15% over next 2 years. |
| Prescriptive (What should be done?) | Recommends specific actions to optimize the system | Open DC in Nagpur — serves 4 cities at minimum cost. Capacity = 20,000 units/month. |
Chained Analytics Example — Product C Demand
Section titled “Chained Analytics Example — Product C Demand”- Descriptive: Product C sales have been high for 3 years.
- Predictive: Demand forecasting model says Product C will grow 15% in next 2–3 years.
- Prescriptive: Do I have capacity? If not — add factory or DC? Where? → optimization model answers: expand existing factory, open a new one, or open a 3rd DC at a specific optimal location.
7. Supply Chain Digital Twin — Use Cases
Section titled “7. Supply Chain Digital Twin — Use Cases”DT acts as a digital companion for decision makers — analytically driven decisions across the entire SC:
| Use Case | How DT Helps |
|---|---|
| Production Planning & Control | Decide how much of Product A, B, C to produce at which factory. Matches supply with demand. Prescriptive analytics determines optimal production schedule. |
| Inventory Control | Decide how much of each SKU to stock at each DC and customer location. Minimizes cost of overstocking + understocking simultaneously. |
| Shipment Control | Track truck location in real time. Decide: factory A → which DC? Which DC → which customers? Optimizes routing and load planning. |
| Quality Control | Monitor temperature + humidity in cold chain trucks in real time. Alerts raised if conditions deviate — prevents product spoilage. Pharma, food, blood, chemicals. |
| Resiliency Management | If a supplier location is disrupted — DT identifies alternate supplier, location, quantity. Prescriptive model suggests recovery plan automatically. |
| Sustainability / Environmental Impact | Calculate CO₂ emissions for a proposed SC network redesign — before implementing it. Evaluate environmental impact of new factory, DC, or route. |
| Collaborative Planning | Collaborative demand forecasting with partners → more accurate forecasts. Collaborative sourcing → better supplier selection, lower cost. Transparency reduces friction. |
8. Advantages of Supply Chain Digital Twin
Section titled “8. Advantages of Supply Chain Digital Twin”- End-to-End Visibility: Know exact location of factories, DCs, customers, and products at any moment. Know which routes are active and product movement status in real time.
- Enhanced Traceability (Blockchain-enabled): Faulty product → trace which part → which component → which supplier → which plant and raw material source. Full backward trace: customer complaint → factory → component supplier → raw material origin.
- Transparent & Accurate Decision Making: Decisions driven by real-time data + analytical models — not intuition or approximation. Reduces human error and information gaps.
- Better Collaboration: Visibility and traceability make the system transparent to all partners. Enables collaborative demand forecasting, collaborative sourcing. Less under/overstocking across the SC.
Session Summary
Section titled “Session Summary”- Digital Twin definition: virtual replica of a physical system — mimics attributes, behaviour, interactions using sensor data, IoT, modelling.
- 5 types (pyramid): Product → Process → Company/Enterprise → SC Network → Network of Networks (complexity increases upward).
- Data sources: CAD/CAM (product) → MES (process) → ERP (company) → logistics software + external data (SC network).
- 4 enabling technologies: IoT (data) + Blockchain (traceability) + AI/ML (intelligence) + Cloud (compute).
- 3 DT components: Digital Visualization + Digital Technologies + Decision Support (Descriptive + Predictive + Prescriptive).
- 7 use cases: Production planning, Inventory control, Shipment control, Quality control, Resiliency, Sustainability, Collaboration.