Week 6 | Session 3: Predictive Maintenance — Classification Tree Case Study
Course: Supply Chain Digitization — Module 2: Digital Business in SC
Session Agenda
Section titled “Session Agenda”Case Study Context — The Problem
Section titled “Case Study Context — The Problem”- Setting: Manufacturing plant with intermittent production stoppages over the last few months
- Problem: Machines breaking down 1–2 times per month → production halts → customers not getting products on time → customer churn risk
- Stakeholder: New plant manager (data science trained) appointed to solve this
- Goal: Develop a predictive model to forecast WHICH machine will fail BEFORE it actually breaks down → take proactive corrective action → eliminate production stoppages
- Analytics type used: Predictive analytics (classification model) → also feeds into Prescriptive (schedule maintenance before failure)
- Model chosen: Classification tree (subset of Decision Tree) — chosen because it is interpretable by shop floor workers, not just data scientists
Data Collected — 1000 Instances, 7 Features + 1 Target
Section titled “Data Collected — 1000 Instances, 7 Features + 1 Target”- Dataset size: 1000 historical instances — each representing one machine over one observation period
- Data includes BOTH failure and non-failure instances: Critical — model must learn to distinguish between the two. Having only failure data would bias the model.
Features collected and what they represent
Section titled “Features collected and what they represent”| Feature (Input Variable) | Unit / Scale | What It Represents |
|---|---|---|
| Age of machine | Years | How long the machine has been in operation. Older machines → higher failure risk. |
| Utilization | % (0–100) | Percentage of time the machine is being used. Higher utilization → more wear → higher failure risk. |
| MTBF (Mean Time Between Failures) | Hours/days | Average time between two successive failures. Higher MTBF → machine failing less frequently → lower current risk. |
| Unplanned Downtime | % | Percentage of time machine was down unexpectedly (not scheduled maintenance). Higher = more historical failure incidents. |
| Oil Contamination (NAS value) | NAS scale | Cleanliness of machine oil. Higher contamination = dirty oil = higher risk of mechanical failure. |
| Overhauling Schedule Compliance | % (0–100) | How consistently planned overhauls are carried out. 95.6% = overhaul missed only 4.4% of scheduled times. Lower % = more missed overhauls = higher failure risk. |
| Schedule Lubrication Compliance | % (0–100) | How consistently scheduled lubrication is carried out. Lower = more missed lubrication = higher friction = higher failure risk. |
| Machine Failure? (Target variable) | Binary: 1/0 (Yes/No) | Whether the machine actually failed (1) or did not fail (0) in that instance. This is what the model must PREDICT. |
(Sample data provided for instances 0-4 and 995-999 to train and test the model).
Why Classification Tree (Decision Tree)?
Section titled “Why Classification Tree (Decision Tree)?”- Problem type: Binary classification — machine will FAIL (1) or will NOT FAIL (0)
- Key requirement: Model must be interpretable by shop floor workers (not just data scientists) → decision tree provides clear IF-THEN rules
- Alternative models: Logistic regression, neural networks, random forest — accurate but harder to explain to non-technical staff
- Decision tree advantage: Visual, rule-based structure → workers can follow a simple flowchart → no data science background needed to use the output
- Output: Prediction (fail/not fail) + probability of failure + support for that probability
Decision Tree Output — 4 Leaf Nodes (Business Rules)
Section titled “Decision Tree Output — 4 Leaf Nodes (Business Rules)”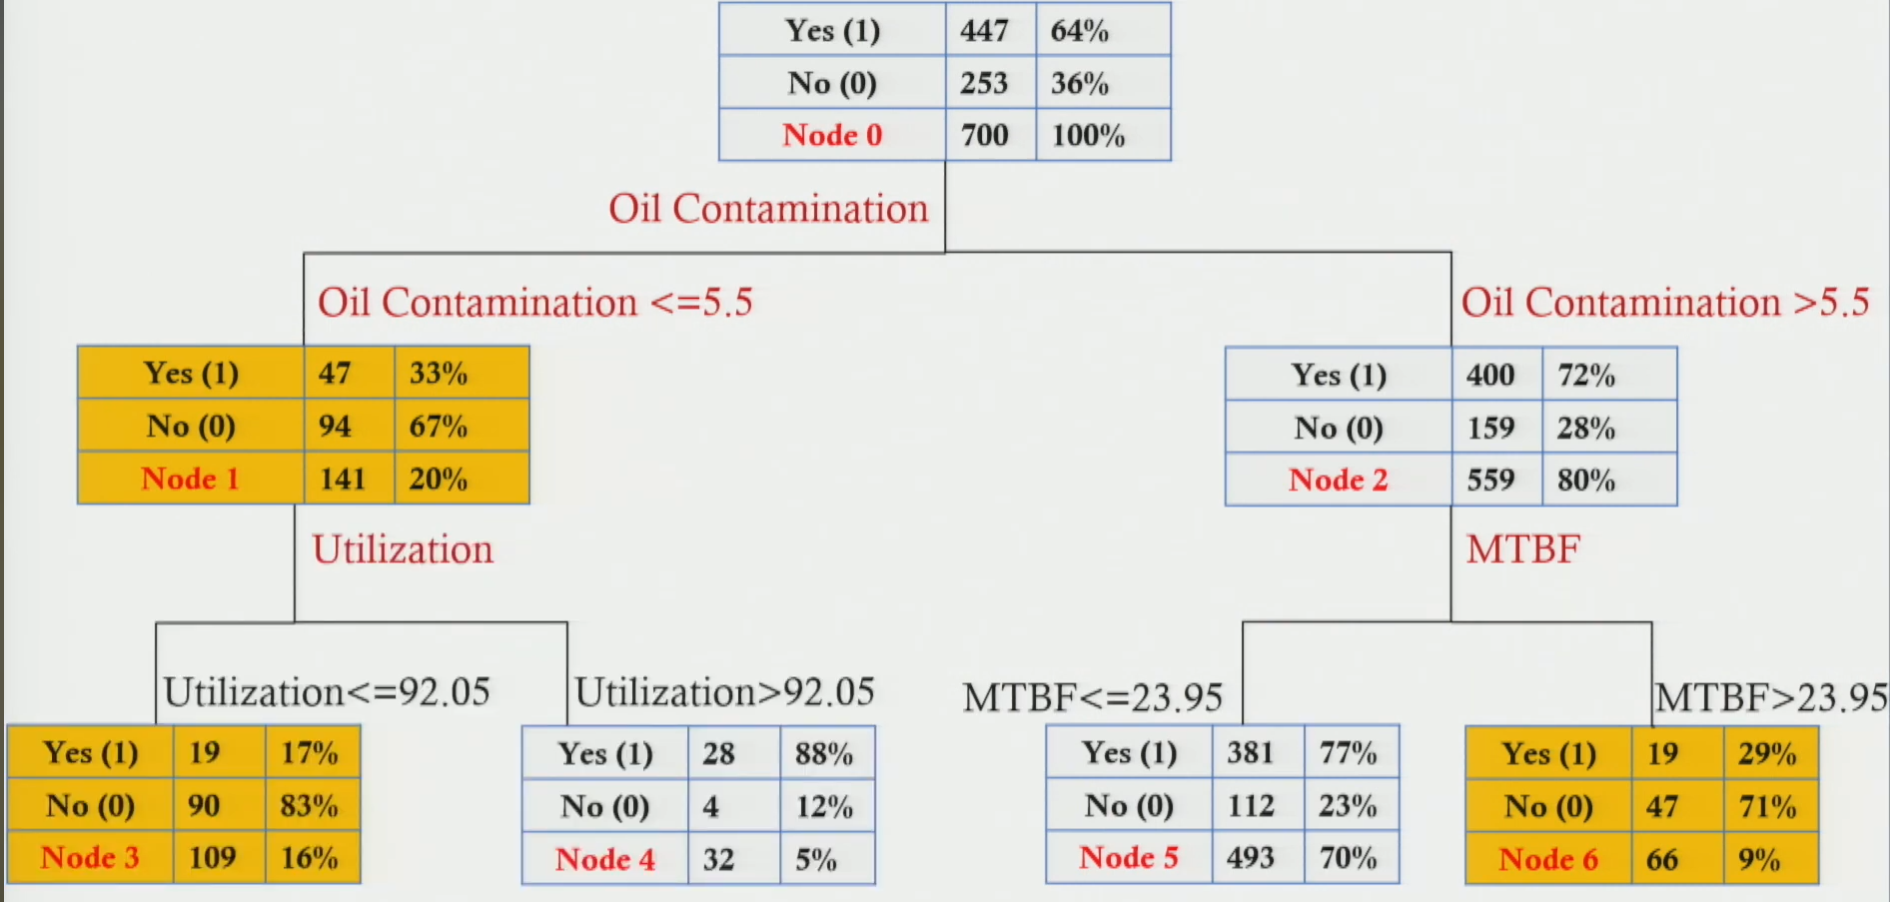
- Key insight: Out of 7 input features, the model uses only 3 for prediction: Oil Contamination | MTBF | Utilisation
- Root split (Node 0): First split is on Oil Contamination at threshold 5.5
- Oil Contamination > 5.5 → go right (Node 2) → then check MTBF
- Oil Contamination ≤ 5.5 → go left (Node 1) → then check Utilisation
- Leaf nodes (4 terminal nodes — 3, 4, 5, 6): Each gives a prediction + probability + support
Decision tree leaf nodes — business rules for shop floor use
Section titled “Decision tree leaf nodes — business rules for shop floor use”| Node | Condition 1 (Oil Contamination) | Condition 2 (Utilisation or MTBF) | Prediction | Classification Accuracy (Prob.) | Support |
|---|---|---|---|---|---|
| 3 | Oil ≤ 5.5 | Utilisation ≤ 92.05% | Will NOT fail ✓ | 83% | 16% |
| 4 | Oil ≤ 5.5 | Utilisation > 92.05% | Will FAIL ✗ | 88% | 5% |
| 5 | Oil > 5.5 | MTBF ≤ 23.95 | Will FAIL ✗ | 77% | 70% |
| 6 | Oil > 5.5 | MTBF > 23.95 | Will NOT fail ✓ | 71% | 9% |
Understanding the Output — Three Key Terms
Section titled “Understanding the Output — Three Key Terms”- Prediction: “Will FAIL” or “Will NOT FAIL” — the model’s classification for that combination of parameter values.
- Accuracy / Probability: What % of instances with this rule combination actually had that outcome in historical data. E.g. 77% means 77 out of 100 machines with Oil > 5.5 and MTBF ≤ 23.95 actually failed.
- Support: What % of the total 1000 instances fall into this node. 70% support = 700 of 1000 training instances land in Node 5. High support = rule is based on more data = more confidence in the rule.
Shop Floor Business Rules — How Workers Use the Model
Section titled “Shop Floor Business Rules — How Workers Use the Model”Print the 4 business rules and post them in the shop floor. Workers only need to monitor 3 parameters:
- Oil Contamination (NAS value — check against threshold 5.5)
- MTBF (Mean Time Between Failures — check against threshold 23.95)
- Utilisation (% — check against threshold 92.05%)
- Check Oil Contamination. Is it ≤ 5.5 or > 5.5?
- If > 5.5 → check MTBF → follow Node 5 or Node 6 rule
- If ≤ 5.5 → check Utilisation → follow Node 3 or Node 4 rule
- Check the second parameter (MTBF or Utilisation) → arrive at one of 4 leaf nodes.
- Read the prediction + probability → if machine predicted to fail → alert manager → schedule preventive maintenance immediately.
Two Worked Predictions — Apply the Model
Section titled “Two Worked Predictions — Apply the Model”| Parameter | Machine 1 (Example from class) | Machine 2 (Example from class) |
|---|---|---|
| Age | 11 years | 4 years |
| Utilisation | 78% | 91% |
| MTBF | 15 | 24 |
| Unplanned Downtime | 3% | 4% |
| Oil Contamination | 8 (> 5.5) | 5 (≤ 5.5) |
| Overhauling Compliance | 92% | 88% |
| Lubrication Compliance | 90% | 87% |
| Step 1: Check Oil Contamination | 8 > 5.5 → go to Node 2 branch | 5 ≤ 5.5 → go to Node 1 branch |
| Step 2: Check 2nd parameter | MTBF = 15 ≤ 23.95 → Node 5 | Utilisation = 91% ≤ 92.05% → Node 3 |
| Prediction | WILL FAIL ✗ | Will NOT Fail ✓ |
| Accuracy / Probability | 77% | 83% |
| Support | 70% | 16% |
Machine 1 — Walkthrough
Section titled “Machine 1 — Walkthrough”- Oil Contamination = 8 → 8 > 5.5 → follow right branch (Node 2)
- MTBF = 15 → 15 ≤ 23.95 → Node 5
- Prediction: Machine WILL FAIL | Probability = 77% | Support = 70%
- Action: Alert maintenance team immediately. Schedule inspection and servicing before failure occurs.
Machine 2 — Walkthrough
Section titled “Machine 2 — Walkthrough”- Oil Contamination = 5 → 5 ≤ 5.5 → follow left branch (Node 1)
- Utilisation = 91% → 91% ≤ 92.05% → Node 3
- Prediction: Machine will NOT FAIL | Probability = 83% | Support = 16%
- Action: No immediate maintenance needed. Continue normal operations. Monitor oil contamination closely (borderline at 5, close to threshold 5.5).
Interpreting Support — Why It Matters
Section titled “Interpreting Support — Why It Matters”- Node 5: 70% support = 700 of 1000 training instances fall here. This is the most data-rich node → prediction is most reliable.
- Node 4: 5% support = only 50 of 1000 instances. High accuracy (88%) but based on very few data points → use with caution.
- Node 6: 9% support = 90 instances. Reasonable but not as strong as Node 5.
- Node 3: 16% support = 160 instances. Moderate support — reasonably reliable for not-fail prediction.
Rule of thumb: High support + high accuracy = most actionable rule. Low support even with high accuracy = treat the prediction cautiously.
Feature Selection — Why Only 3 of 7 Parameters?
Section titled “Feature Selection — Why Only 3 of 7 Parameters?”Model was given all 7 parameters but the decision tree found that only 3 were needed to make accurate predictions:
- Oil Contamination — most discriminatory variable (used at root split)
- MTBF — second split on the high-contamination branch
- Utilisation — second split on the low-contamination branch
- Age, unplanned downtime, overhauling compliance, lubrication compliance: Not selected by the model — either redundant (correlated with the 3 selected) or less discriminatory
Benefit: Fewer parameters to monitor → simpler for shop floor staff → lower data collection burden → faster decision making
Analytics Chain in This Case Study
Section titled “Analytics Chain in This Case Study”| Analytics Type | How It Was Applied |
|---|---|
| Descriptive | Past machine data collected for 1000 instances across 7 parameters. Historical failure rate identified. Which machines failed most often? How often? When? |
| Diagnostic | Which parameters are associated with failure? Oil contamination, MTBF, and utilisation found to be most discriminatory — these explain WHY machines fail. |
| Predictive | Classification tree trained on 1000 instances → model predicts whether a machine WILL fail given current parameter values. Output: fail/not-fail + probability + support. |
| Prescriptive | When model predicts failure with high probability → prescribe action: schedule preventive maintenance, order replacement parts, adjust oil system, reduce machine utilisation. Goal: prevent the failure from occurring. |
Session Summary
Section titled “Session Summary”- Problem: Manufacturing plant with 1–2 machine breakdowns per month → production halts → customer dissatisfaction
- Approach: Predictive maintenance using classification tree model
- Data: 1000 instances | 7 features (age, utilisation, MTBF, unplanned downtime, oil contamination, overhauling compliance, lubrication compliance) + 1 target (failed / not failed)
- Model: Classification tree — interpretable, rule-based, usable by non-technical shop floor workers
- 3 parameters selected by model: Oil Contamination | MTBF | Utilisation (out of 7 input features)
- 4 business rules (leaf nodes): Node 3 (not fail, 83%, 16%) | Node 4 (fail, 88%, 5%) | Node 5 (fail, 77%, 70%) | Node 6 (not fail, 71%, 9%)
- Machine 1 prediction: Oil = 8 > 5.5, MTBF = 15 ≤ 23.95 → Node 5 → WILL FAIL (77% probability)
- Machine 2 prediction: Oil = 5 ≤ 5.5, Utilisation = 91% ≤ 92.05% → Node 3 → Will NOT FAIL (83% probability)
- Next session: Build this classification tree from scratch — theory + Python hands-on coding