Week 3 | Session 2: Operations–Finance Interface & DuPont Model (Return on Assets)
Course: Supply Chain Digitization
Session Context & Scope
Section titled “Session Context & Scope”DuPont Model — Adapted for Operations
Section titled “DuPont Model — Adapted for Operations”Core Formula
Section titled “Core Formula”DuPont Decomposition Tree
Section titled “DuPont Decomposition Tree”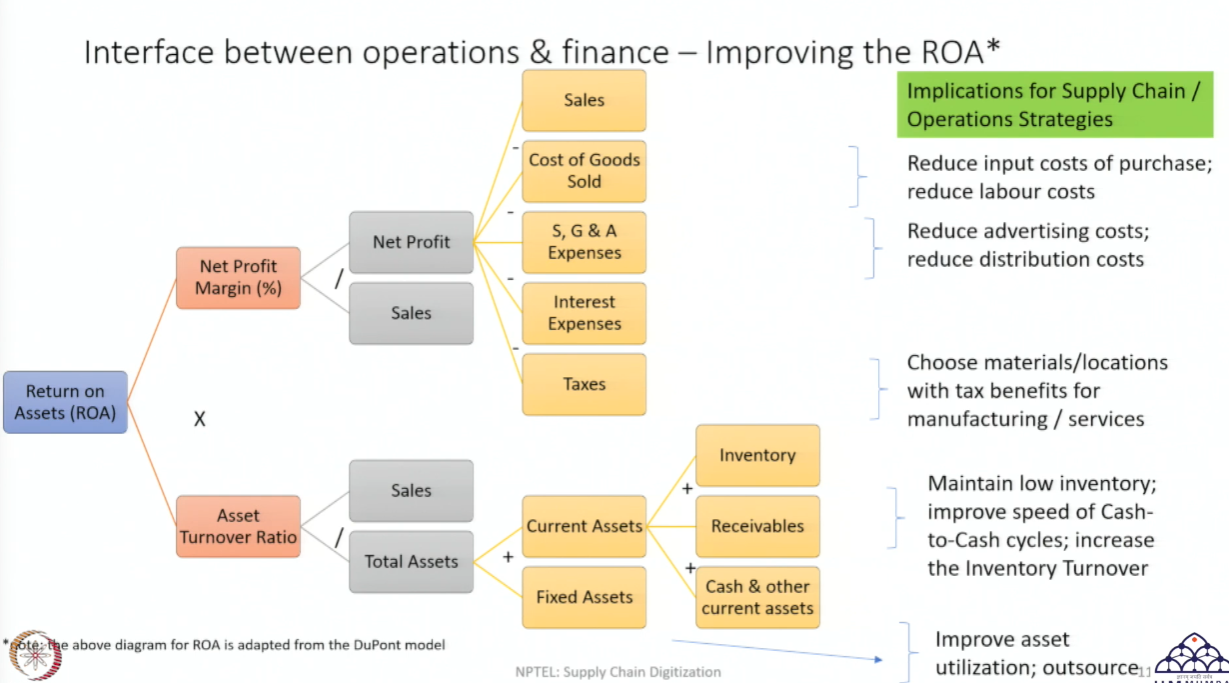
Part 1 — Net Profit Margin
Section titled “Part 1 — Net Profit Margin”Definition & Formula
Section titled “Definition & Formula”Building Up to Net Profit
Section titled “Building Up to Net Profit”Net Profit
Section titled “Net Profit”Cost of Goods Sold (COGS)
Section titled “Cost of Goods Sold (COGS)”All costs directly related to producing and distributing the product:
| Cost Component | Description |
|---|---|
| Cost of Purchase | Amount paid to vendors for raw materials and inputs |
| Labour Cost | Workers directly involved in manufacturing — packaging, cleaning, equipment setup, material movement, and shop-floor activities |
SGA Expenses — Selling, General & Administrative
Section titled “SGA Expenses — Selling, General & Administrative”Costs not directly linked to manufacturing the product:
| Category | Examples |
|---|---|
| Selling | Advertisement and promotion costs |
| General & Administrative | IT staff, infrastructure management, customer relations, non-shop-floor employees |
Other Deductions from Profit
Section titled “Other Deductions from Profit”| Deduction | Owed To |
|---|---|
| Interest Expenses | Banks — cost of borrowing capital |
| Taxes | Government — income tax on profits |
Operations Strategy Levers for Net Profit Margin
Section titled “Operations Strategy Levers for Net Profit Margin”| Lever | Financial Impact |
|---|---|
| Reduce cost of raw material inputs through procurement negotiation | ↓ COGS |
| Reduce labour cost through process efficiency or automation | ↓ COGS |
| Reduce advertising and distribution costs | ↓ SGA |
| Choose tax-advantaged manufacturing locations (e.g., Special Economic Zones) | ↓ Tax liability |
| Increase sales volume or price point | ↑ Revenue base → improves margin denominator |
Part 2 — Asset Turnover Ratio
Section titled “Part 2 — Asset Turnover Ratio”Definition & Formula
Section titled “Definition & Formula”Total Assets = Fixed Assets + Current Assets
Section titled “Total Assets = Fixed Assets + Current Assets”Fixed Assets
Section titled “Fixed Assets”Physical assets used to produce or deliver the product — they are not themselves sold as the product:
| Type | Examples |
|---|---|
| Manufacturing infrastructure | Plants, factories, production equipment |
| Logistics infrastructure | Fleet of vehicles, warehouses owned by the firm |
Current Assets
Section titled “Current Assets”Assets that can be quickly liquidated (converted to cash) — typically within the financial year:
| Current Asset Type | Description |
|---|---|
| Inventory | Finished goods, work-in-process (WIP), and raw materials. Examples: A shampoo bottle = finished goods; dyes, chemicals, plastic = WIP. Can be sold in the market to generate cash. |
| Receivables | Money owed to the firm by customers who purchased on credit. More common in B2B settings than B2C — businesses routinely operate on credit terms. Can be liquidated and treated as a current asset. |
| Cash & Other Current Assets | Already fully liquid — immediately available to finance operations. Used for: paying wages, paying small vendors, and covering day-to-day expenses. |
Operations Strategy Levers for Asset Turnover Ratio
Section titled “Operations Strategy Levers for Asset Turnover Ratio”| Lever | Financial Impact |
|---|---|
| Reduce excess inventory through lean practices | ↓ Current assets → ↑ turnover ratio |
| Increase inventory turnover — move stock out to consumers faster | ↑ Sales per unit of inventory held |
| Improve cash-to-cash cycle speed — accelerate how fast cash is regenerated from operations | ↑ Liquidity and asset efficiency |
| Maximise equipment and machinery utilisation | ↑ Output per unit of fixed asset |
| Outsource capital-intensive activities to 3PL / contract manufacturers | ↓ Fixed asset ownership → ↑ turnover ratio |
Critical Insight — Levers Are Interconnected, Not Independent
Section titled “Critical Insight — Levers Are Interconnected, Not Independent”Industry Examples — SC Decisions Traced to ROA Impact
Section titled “Industry Examples — SC Decisions Traced to ROA Impact”Example 1 — Electric Vehicles for Last-Mile Delivery
Section titled “Example 1 — Electric Vehicles for Last-Mile Delivery”Example 2 — Asset-Light Model via 3PL
Section titled “Example 2 — Asset-Light Model via 3PL”Example 3 — Digital Transformation: Automating Information Processing
Section titled “Example 3 — Digital Transformation: Automating Information Processing”Example 4 — UX-Driven Inventory Turnover in E-Commerce
Section titled “Example 4 — UX-Driven Inventory Turnover in E-Commerce”Session Summary
Section titled “Session Summary”| Component | Formula | Operations Levers |
|---|---|---|
| Net Profit Margin | Net Profit / Sales | ↓ Input costs (COGS), ↓ Admin costs (SGA), ↓ Tax via SEZ, ↑ Volume/Price |
| Asset Turnover Ratio | Sales / Total Assets | ↓ Excess inventory, ↑ Equipment utilisation, Outsource fixed assets via 3PL |
| ROA | Net Profit Margin × Asset Turnover Ratio | Optimise both components — but always account for lever interactions |
Industry Example → DuPont Impact Map
Section titled “Industry Example → DuPont Impact Map”| SC Decision | DuPont Impact |
|---|---|
| EV adoption for last-mile delivery | ↓ Fuel cost (COGS) → ↑ Net Profit Margin |
| 3PL outsourcing (asset-light) | ↓ Fixed assets → ↑ Asset Turnover Ratio |
| Digital / email automation | ↓ SGA admin cost → ↑ Net Profit Margin |
| E-commerce UX improvement | ↑ Sales + ↓ Inventory → ↑ Asset Turnover Ratio |