Week 9 | Session 2: K-means Clustering — Algorithm, WCSS & Elbow Method
Course: Supply Chain Digitization — Module 3: Analytics in SCM
Session Agenda
Section titled “Session Agenda”1. K-means Clustering — 5-Step Algorithm
Section titled “1. K-means Clustering — 5-Step Algorithm”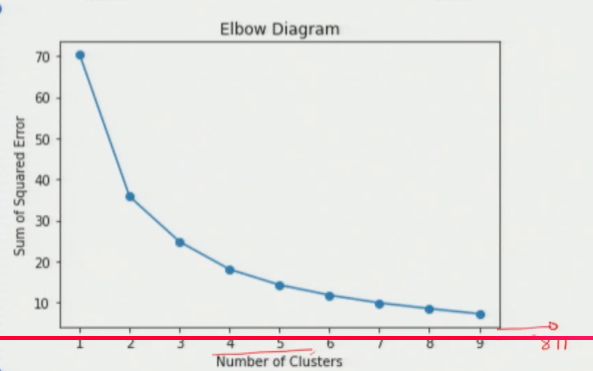
Assume K is already decided (e.g., K = 3 means we want 3 DCs).
- Randomly select K initial centroids: Choose K arbitrary points as starting locations.
- Calculate Euclidean distance: From every point to each centroid. Each customer gets K distance values.
- Assign each data point to its nearest centroid: Form clusters.
- Recompute centroid for each cluster: New centroid = average of all points currently in that cluster.
- Repeat steps 3 & 4 until convergence: Convergence = centroids stop moving AND no data point changes its cluster.
2. Key Formulas
Section titled “2. Key Formulas”Euclidean Distance — Step 2
Section titled “Euclidean Distance — Step 2”Distance from customer (xi, yi) to centroid k (μk, ηk):
d(i → k) = √ [ (xi − μk)² + (yi − ηk)² ]
Centroid Recalculation — Step 4
Section titled “Centroid Recalculation — Step 4”After forming clusters, recompute each centroid as the mean of its members:
New centroid = ( Σxi / n , Σyi / n )
(x-coordinate = average of all xi in cluster; y-coordinate = average of all yi in cluster)
3. Within-Cluster Sum of Squares (WCSS)
Section titled “3. Within-Cluster Sum of Squares (WCSS)”WCSS = sum of squared distances from every point to its cluster centroid.
- Measures how compact / tight the clusters are.
- Lower WCSS = customers are closer to their DC = better responsiveness.
How WCSS Changes with K
Section titled “How WCSS Changes with K”As K increases, WCSS always decreases — more clusters mean tighter groupings.
- K = 1: All 811 in one cluster → WCSS is maximum.
- K = 811: Every customer is its own cluster → WCSS = 0 (infeasible).
Neither extreme is practical → need to find the sweet spot using the Elbow Method.
4. Elbow Method — Determining Optimal K
Section titled “4. Elbow Method — Determining Optimal K”Concept
Section titled “Concept”Plot WCSS (y-axis) vs K (x-axis). The curve drops steeply at first, then flattens. The bend = elbow. The K at the elbow = optimal number of DCs (best balance of responsiveness vs cost). Beyond elbow: adding more DCs gives little additional benefit in WCSS but raises cost significantly.
Reading the Elbow Chart
Section titled “Reading the Elbow Chart”- 1 → 2 clusters: large gain
- 2 → 3 clusters: large gain
- 3 → 4 clusters: significant gain
- 4 → 5 clusters: small gain
- 5 → 6+: very marginal reduction Elbow at K = 4 → optimal number of DCs = 4
(K = 5 is acceptable if budget allows, but final decision depends on strategic targets)
5. K-means Output → Input to Optimization Model
Section titled “5. K-means Output → Input to Optimization Model”K-means gives cluster centroids (proposed DC lat/long) and customer-to-DC mapping. These are then fed into a full optimization model to refine the solution further.
| Stage | Detail |
|---|---|
| K-means Output | Cluster centroids (proposed DC locations), Customer-to-DC mapping |
| Used as input to… | Optimization model (LP / CPLP) |
| Optimization adds… | Capacity constraints, demand constraints, transport cost, vehicle routing |
| Final output | Exact DC locations, which DC serves which customers, routing plan |
Session Summary
Section titled “Session Summary”- K-means Algorithm: 5 steps — random centroids → distance calc → assign → recompute centroid → repeat till convergence.
- Euclidean Distance:
d = √[(xi−μk)² + (yi−ηk)²] - Centroid Formula:
(Σxi/n, Σyi/n) - WCSS: Σ squared distances from each point to its centroid. Lower = tighter clusters.
- Elbow Method: Plot WCSS vs K, find bend. K at elbow is optimal number of DCs.
- Case result: Elbow at K = 4. K-means outputs feed into LP optimization model for final refinement.