Week 3 | Session 5: Kraljic Matrix — Example Application (Bottling Plant)
Course: Supply Chain Digitization
Example Context — The Bottling Plant
Section titled “Example Context — The Bottling Plant”The 8 Procured Items — Overview
Section titled “The 8 Procured Items — Overview”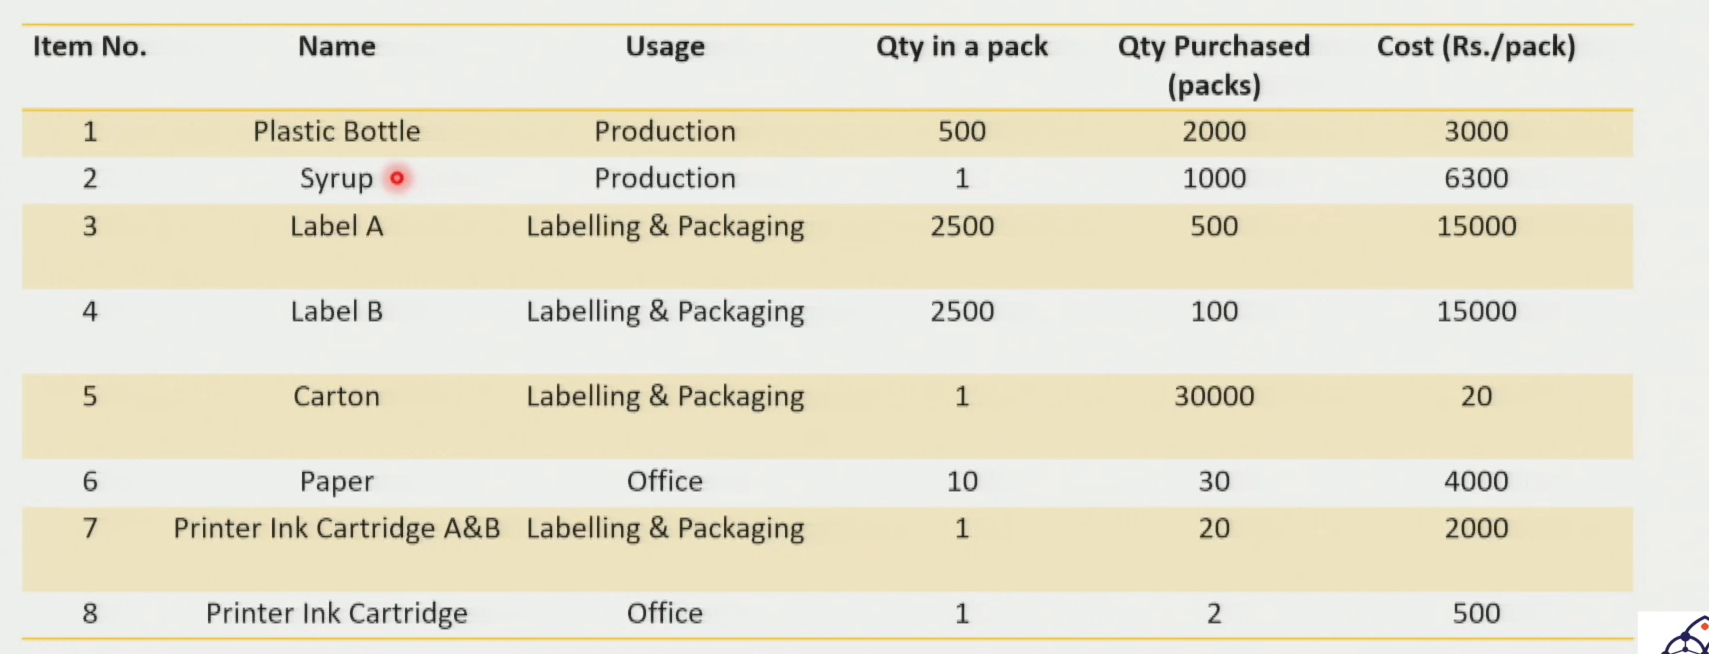
Item categories:
| Category | Items |
|---|---|
| Production | Plastic Bottle, Syrup, Label A, Label B, Cartons |
| Office / Admin | A4 Paper, Ink Cartridge A (labelling), Ink Cartridge B (office) |
Procurement Data — 8 Items at a Glance
Section titled “Procurement Data — 8 Items at a Glance”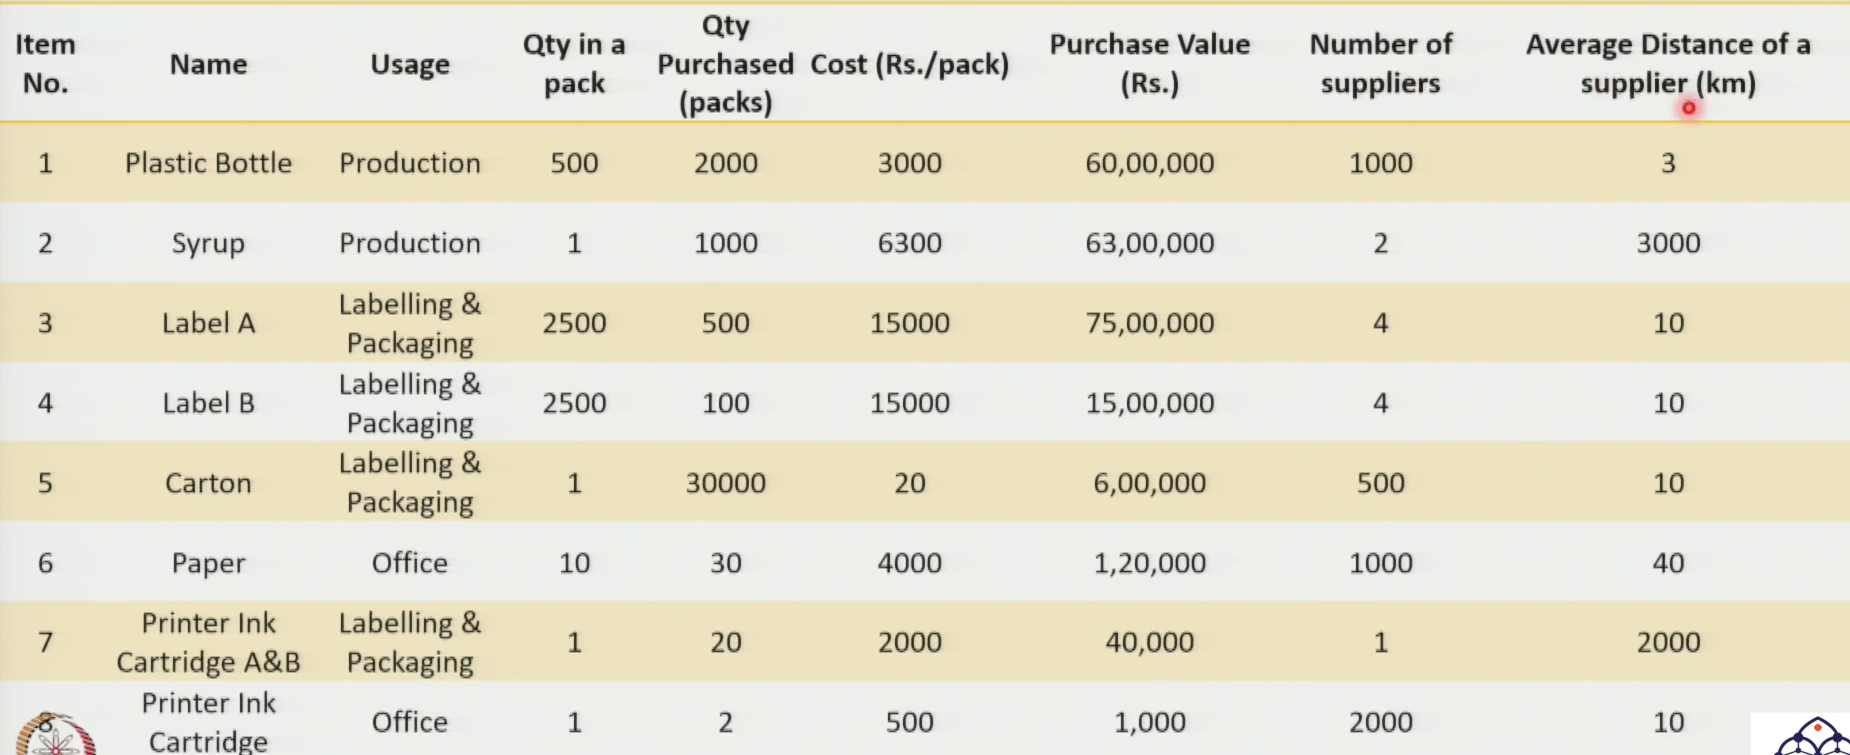
Item-wise procurement data and preliminary quadrant classification:
| Item | Pack Size | Packs Bought | Cost/Pack (₹) | Total Value | No. of Suppliers | Avg. Distance | Quadrant |
|---|---|---|---|---|---|---|---|
| Plastic Bottle | 500 units | 2,000 | ₹3,000 | High | 1,000 | Very close | Leverage |
| Syrup | 1 barrel | 1,000 | ₹6,300 | High | 2 | Very far (intl.) | Strategic |
| Label A | 2,500 labels | 500 packs | ₹15,000 | ₹75 lakh | 4 | Far | Strategic |
| Label B | 2,500 labels | 100 packs | ₹15,000 | Low | 4 | Far | Bottleneck |
| Carton | 1 carton | 30,000 | ₹20 | Moderate | Many | Moderate | Bottleneck |
| Paper (A4) | 10 reams | 30 | ₹4,000 | Low | Many | Moderate | Non-Critical |
| Ink Cartridge A (labelling) | 1 unit | 20 | ₹2,000 | Low | 1 | Very far | Bottleneck |
| Ink Cartridge B (office) | 1 unit | 2 | ₹500 | ~₹1,000 | Many | Close | Non-Critical |
Key Observations from the Data
Section titled “Key Observations from the Data”Profit Impact (Purchase Value)
Section titled “Profit Impact (Purchase Value)”| Item | Observation |
|---|---|
| Label A | Highest total value at ₹75 lakh — the pack size (2,500 labels) makes this look expensive per unit, but the volume is what drives total cost |
| Plastic Bottle & Syrup | Also high total value — syrup at ₹6,300/barrel is expensive per unit |
| Office supplies | Very low total value — Paper and Ink Cartridge B together total only ~₹1,000 |
| Carton | 30,000 units purchased but at ₹20 each — moderate total value despite high volume |
Supply Risk
Section titled “Supply Risk”| Risk Level | Items | Reason |
|---|---|---|
| High risk — few suppliers | Syrup (2), Labels A & B (4 each), Ink Cartridge A (1 supplier only) | Limited sourcing options |
| Low risk — many suppliers | Plastic Bottle (1,000), Carton, Paper, Ink Cartridge B | Abundant options |
| High risk — far distance | Syrup (international), Ink Cartridge A (very far) | Long replenishment lead times |
| Low risk — close distance | Plastic Bottle (very close) | Quick replenishment possible |
Building a Composite Supply Risk Metric
Section titled “Building a Composite Supply Risk Metric”The Problem with Two Sub-Metrics
Section titled “The Problem with Two Sub-Metrics”The two available supply risk sub-metrics operate in opposite directions — they cannot be combined without normalisation:
| Sub-metric | Direction | Interpretation |
|---|---|---|
| Number of suppliers | More suppliers → lower risk | Inverse relationship |
| Average distance | Greater distance → higher risk | Direct relationship |
Scaling Approach
Section titled “Scaling Approach”All metrics are converted to comparable scales before combining:
| Metric | Scale | Logic |
|---|---|---|
| Profit Impact | 0–10 | 0 = lowest value item, 10 = highest value item |
| No. of Suppliers | 1–10 | 1 = fewest suppliers = highest risk; 10 = most suppliers = lowest risk |
| Avg. Distance | 1–10 | 1 = farthest = highest risk; 10 = closest = lowest risk |
Weighted Supply Risk Formula
Section titled “Weighted Supply Risk Formula”Weighted Supply Risk Results
Section titled “Weighted Supply Risk Results”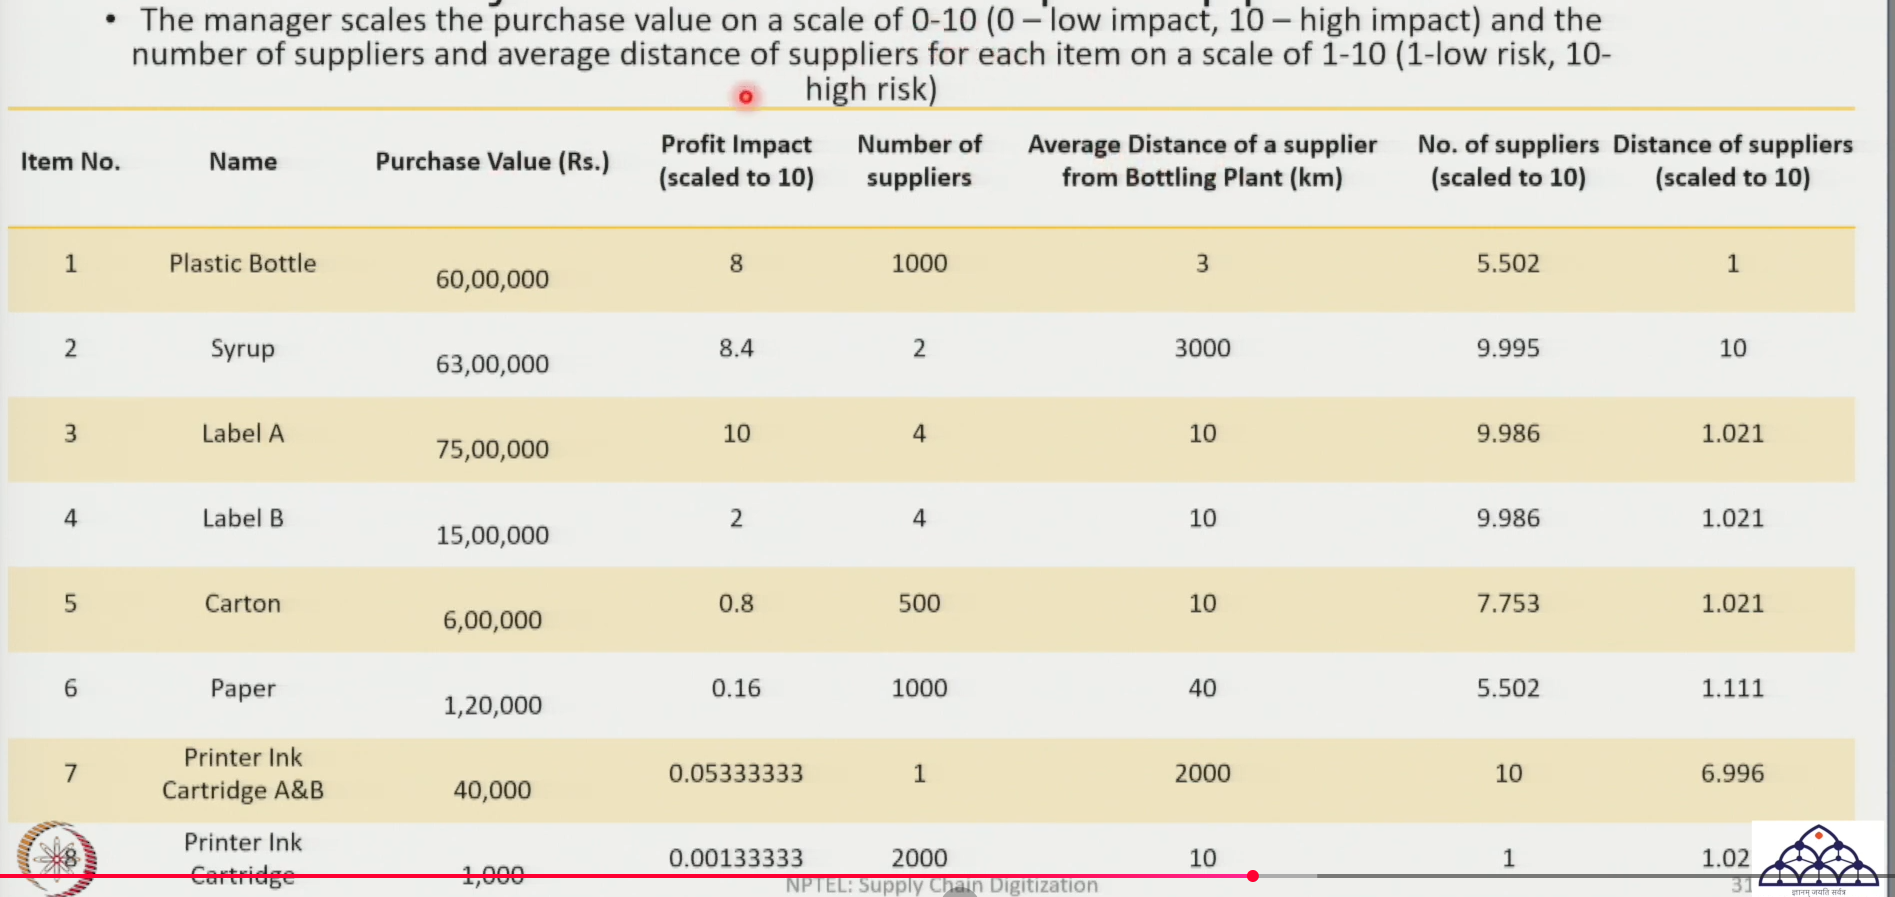
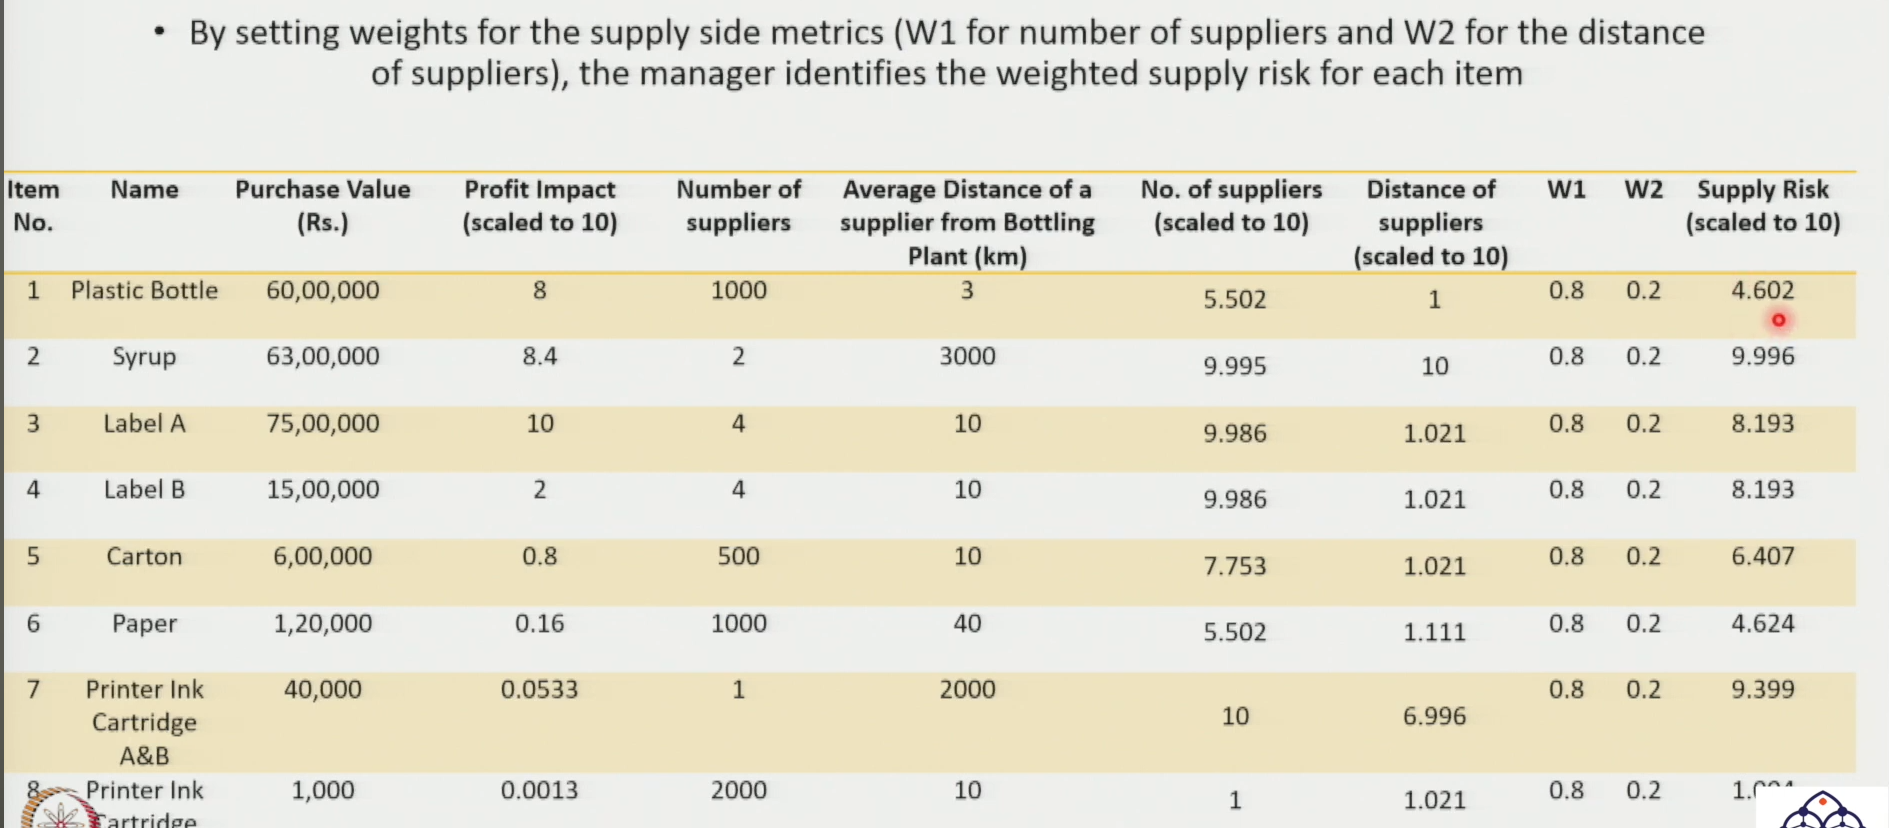
Weighted supply risk ranking — key results:
| Item | Supply Risk Level | Primary Driver |
|---|---|---|
| Syrup | Highest (~9.996) | Only 2 suppliers + international distance |
| Ink Cartridge A (labelling) | High | Only 1 supplier + very far location |
| Label A & B | Moderate-high | Only 4 suppliers + far location |
| Ink Cartridge B (office) | Low | Many suppliers + close location |
| Paper (A4) | Low | Many suppliers + moderate distance |
| Plastic Bottle | Low | 1,000 suppliers + very close location |
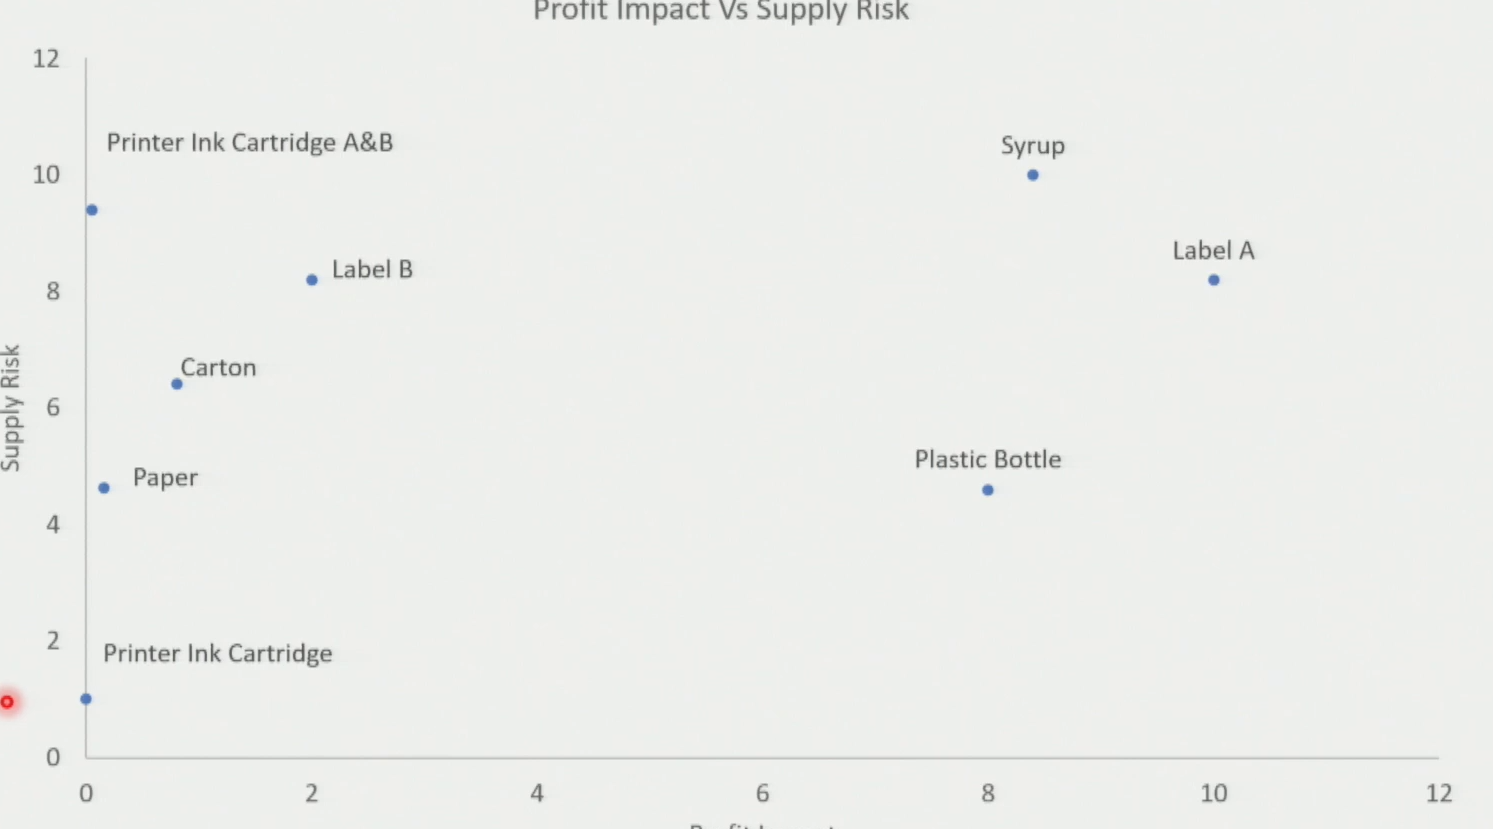
Plotting & Classification on the Kraljic Matrix
Section titled “Plotting & Classification on the Kraljic Matrix”- X-axis: Profit Impact (0–10)
- Y-axis: Weighted Supply Risk (1–10)
- Cutoff applied: Score > 6 on either axis = classified into the “high” side of that dimension
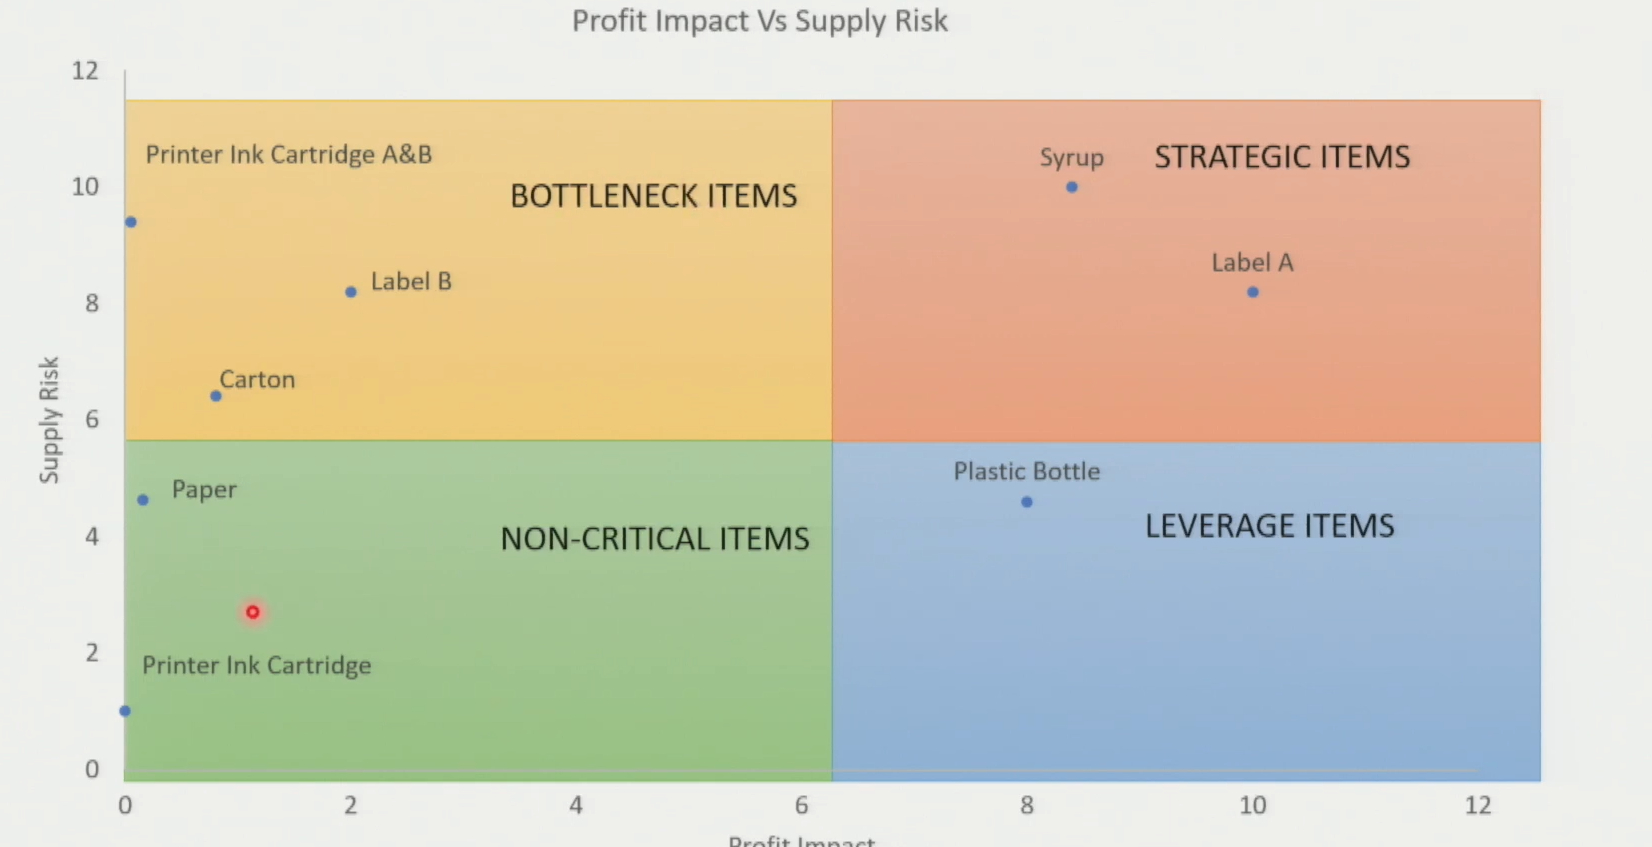
Resulting Quadrant Classification
Section titled “Resulting Quadrant Classification”| Quadrant | Items |
|---|---|
| Strategic (High PI + High Risk) | Syrup, Label A |
| Bottleneck (Low PI + High Risk) | Label B, Carton, Ink Cartridge A (labelling) |
| Leverage (High PI + Low Risk) | Plastic Bottle |
| Non-Critical (Low PI + Low Risk) | Paper (A4), Ink Cartridge B (office) |
Current Procurement State — Review
Section titled “Current Procurement State — Review”Before recommending changes, the current practice for each item is assessed against its quadrant:
| Item | Quadrant | Current Practice | Issue Identified |
|---|---|---|---|
| Plastic Bottle | Leverage | Same supplier for 5 years | Not using buyer power — 1,000 suppliers available |
| Syrup | Strategic | Same supplier 10 years; yearly contract renegotiation | High dependency; only 2 suppliers; international distance adds risk |
| Label A | Strategic | Supplier chosen yearly by cost negotiation | Price volatile year to year; only 4 suppliers |
| Label B | Bottleneck | Supplier chosen yearly | Low value but supply risk still present — few suppliers, far location |
| Carton | Bottleneck | Yearly selection | Risk exists despite moderate supplier numbers |
| Paper (A4) | Non-Critical | Spot purchases as needed ✓ | Possibly over-spending; worth reviewing digital alternatives |
| Ink Cartridge A | Bottleneck | 3-year contract then new supplier | 1 supplier, very far — high production disruption risk |
| Ink Cartridge B | Non-Critical | Spot purchases as needed ✓ | Minimal issue |
Recommended Procurement Strategies
Section titled “Recommended Procurement Strategies”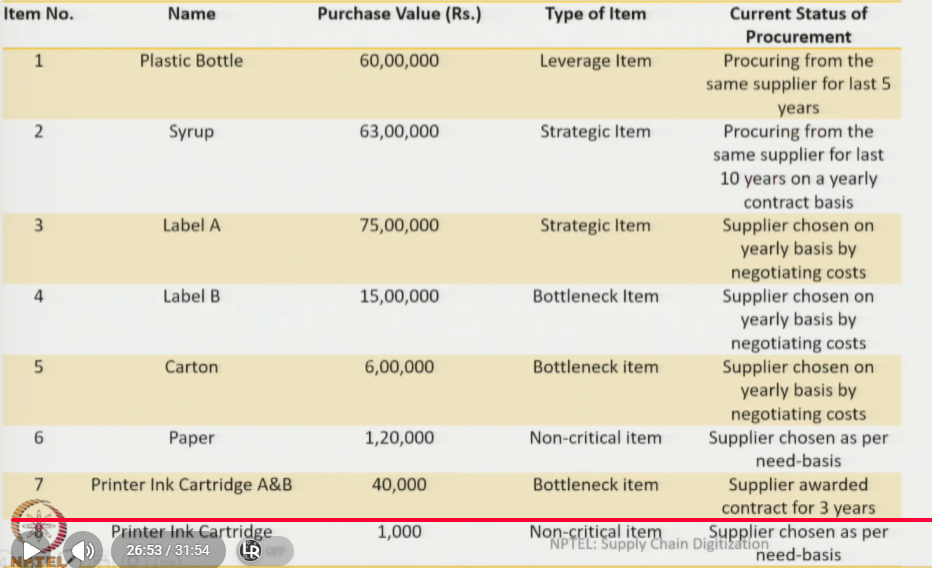
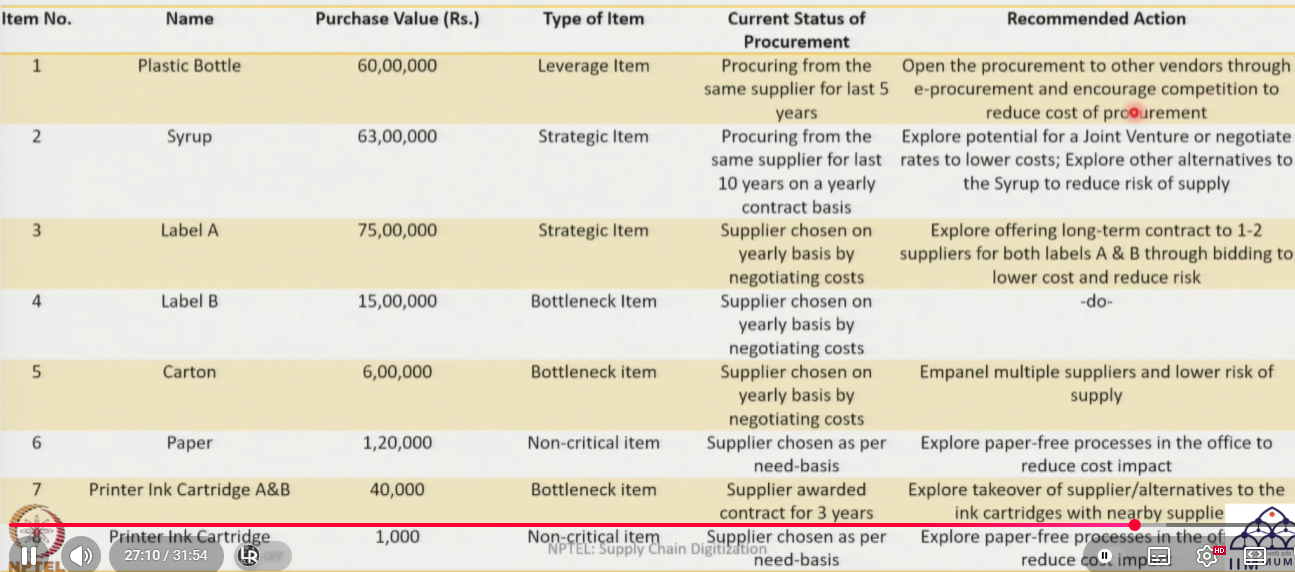
Full recommendations — current practice vs. action:
| Item | Quadrant | Current Practice | Issue | Recommended Action |
|---|---|---|---|---|
| Plastic Bottle | Leverage | Same supplier for 5 years | Not leveraging buyer power despite 1,000 suppliers | Open competitive tendering → invite bids → drive down procurement cost |
| Syrup | Strategic | Same supplier 10 years; yearly renegotiation | High dependency; only 2 suppliers; international distance | Explore JV; negotiate long-term rates; evaluate substitutes if formulation flexibility exists |
| Label A | Strategic | Supplier chosen yearly by cost negotiation | Price volatile year to year; only 4 suppliers | Offer multi-year contracts to 2–3 suppliers; distribute procurement to reduce single-source risk and stabilise cost |
| Label B | Bottleneck | Supplier chosen yearly | Low value but supply risk present — few suppliers, far location | Multi-year contract to reduce supply disruption risk |
| Carton | Bottleneck | Yearly selection | Supply risk still present despite moderate supplier count | Empanel multiple suppliers → reduce single-point-of-failure risk |
| Paper (A4) | Non-Critical | Spot purchases as needed | Possibly over-spending; worth reviewing | Explore paperless / digital processes; continue spot purchasing in the interim |
| Ink Cartridge A | Bottleneck | 3-year contract then new supplier | 1 supplier, very far — production labelling halts if supply disrupted | Explore supplier takeover OR switch to standard compatible ink from a nearby supplier (substitute strategy) |
| Ink Cartridge B | Non-Critical | Spot purchases as needed | Minimal issue | Explore paperless office; continue spot purchasing |
Logic Behind Key Recommendations
Section titled “Logic Behind Key Recommendations”Plastic Bottle → Competitive Bidding
Section titled “Plastic Bottle → Competitive Bidding”With 1,000 suppliers located nearby, the buyer holds maximum negotiating power. Remaining with one supplier for five years is a missed cost-reduction opportunity. Opening competitive tendering will drive procurement cost down significantly.
Syrup → JV / Long-Term Negotiation / Substitutes
Section titled “Syrup → JV / Long-Term Negotiation / Substitutes”Only 2 suppliers globally, with international distance — the textbook definition of a Strategic item challenge. Yearly renegotiation produces cost instability and relationship fragility.
Label A & B → Long-Term Contracts + Distribute Across Suppliers
Section titled “Label A & B → Long-Term Contracts + Distribute Across Suppliers”Both labels have very few suppliers (4 each) at far locations. Yearly selection creates price instability and fragile relationships.
Fix: Multi-year contract with 2–3 suppliers simultaneously — stabilises cost (Label A, Strategic) and reduces disruption risk (Label B, Bottleneck). Distributing procurement across multiple suppliers eliminates single-point-of-failure exposure.
Ink Cartridge A (Labelling) → Substitute / Nearby Supplier
Section titled “Ink Cartridge A (Labelling) → Substitute / Nearby Supplier”This is the most dangerous bottleneck item in the portfolio — one supplier located very far away. A supply disruption stops in-house label printing, which halts production batching entirely.
Two options:
- Explore supplier takeover if volumes justify it
- Switch to a standard compatible ink from a local or nearby supplier — a substitute strategy that immediately lowers supply risk
Non-Critical Items (Paper, Ink Cartridge B) → Paperless / Spot Purchase
Section titled “Non-Critical Items (Paper, Ink Cartridge B) → Paperless / Spot Purchase”Low value and low risk — no strategic oversight required. Continue spot purchasing and explore going paperless or digital to eventually eliminate the procurement need altogether.
Continuous Improvement — Keeping the Matrix Relevant
Section titled “Continuous Improvement — Keeping the Matrix Relevant”Session Summary — 6-Step Kraljic Application Process
Section titled “Session Summary — 6-Step Kraljic Application Process”- Collect data — purchase value, number of suppliers, average supplier distance for all items in scope
- Scale and weight — normalise sub-metrics to a consistent scale; compute weighted composite supply risk score
- Plot and classify — apply a management-defined cutoff (e.g. 6/10) to assign each item to one of the four quadrants
- Review current state — compare actual procurement practice against the ideal strategy for each quadrant
- Recommend — define targeted strategy per item: competitive bidding / JV / long-term contract / substitution / spot purchase
- Iterate — revisit the matrix regularly; refine weights, metrics, and cutoffs as market conditions evolve