Week 9 | Session 4: Intelligent Decision Tools — Efficiency Measurement & Data Envelopment Analysis (DEA)
Course: Supply Chain Digitization — Module 3: Analytics in SCM
Session Agenda
Section titled “Session Agenda”1. Case Study — Automotive Company: 9 Manufacturing Facilities
Section titled “1. Case Study — Automotive Company: 9 Manufacturing Facilities”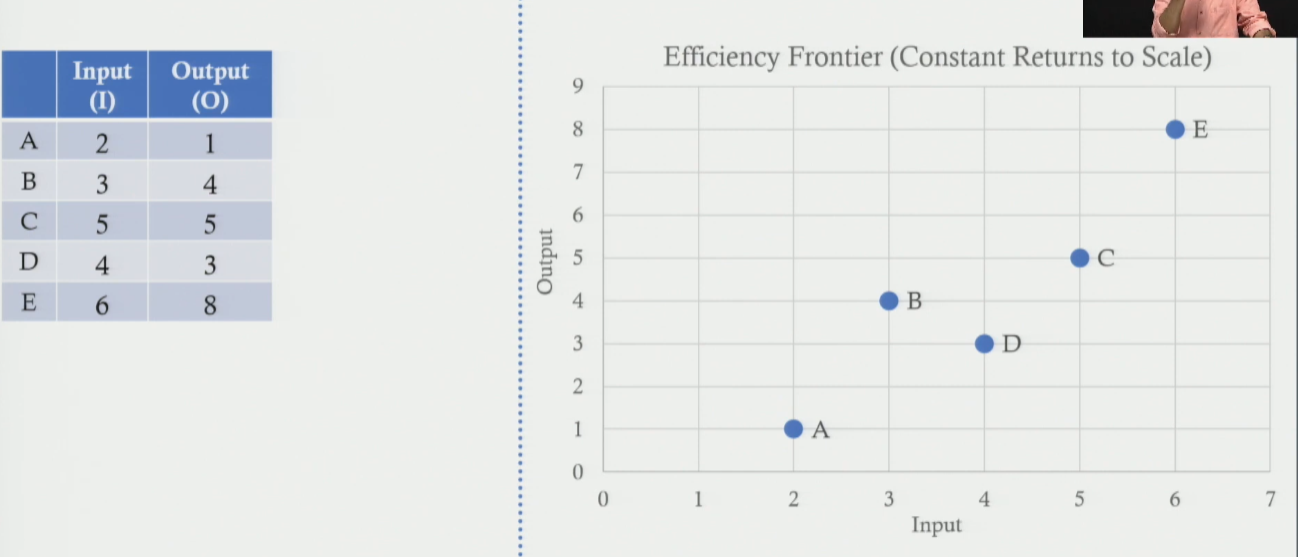
Problem Statement: Senior management wants to measure the efficiency of 9 manufacturing facilities to identify which are efficient, which are not, and where to improve. Improvement options: increase outputs OR reduce inputs.
Parameters Collected
Section titled “Parameters Collected”- Output 1: Production Yield (% of defect-free products)
- Output 2: OEE (Overall Equipment Effectiveness) (%)
- Input 1: Cycle Time (minutes)
- Input 2: Resource Utilization (%)
2. What is Efficiency? — 1 Input, 1 Output Example
Section titled “2. What is Efficiency? — 1 Input, 1 Output Example”Basic Efficiency Formula
Section titled “Basic Efficiency Formula”Efficiency = Output / Input (subject to: Efficiency ≤ 1)
Normalize: Divide all raw ratios by the maximum ratio across all facilities. This ensures maximum efficiency = 1.0 and all others ≤ 1.
| Facility | Input | Output | Output / Input | ÷ Max (1.33) | Efficiency | Status |
|---|---|---|---|---|---|---|
| A | 2 | 1 | 0.50 | 0.375 | 37.5% | Not efficient |
| B | 3 | 4 | 1.33 | 1.000 | 100% | Efficient ★ |
| C | 5 | 5 | 1.00 | 0.750 | 75% | Not efficient |
(Max raw ratio = 1.33. B is efficient. A and C are not.)
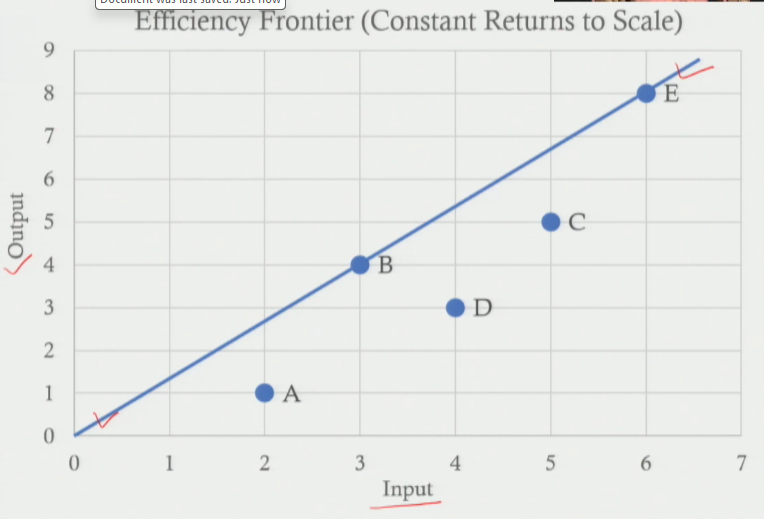
3. Efficient Frontier
Section titled “3. Efficient Frontier”A line/curve connecting all facilities with efficiency = 1.0.
- Efficient facilities already lie ON the frontier.
- Inefficient facilities lie BELOW the frontier.
How to Make an Inefficient Facility Efficient
Section titled “How to Make an Inefficient Facility Efficient”Two strategies:
- Increase output: with the same input, produce more → move UP to the frontier.
- Reduce input: produce the same output with less input → move LEFT to the frontier.
4. Efficiency with Multiple Inputs & Outputs
Section titled “4. Efficiency with Multiple Inputs & Outputs”For 2 outputs and 2 inputs, a simple O/I ratio no longer works — need a weighted formula.
Efficiency = Weighted Sum of Outputs ÷ Weighted Sum of Inputs
= (V1·Y1 + V2·Y2) ÷ (U1·X1 + U2·X2) ≤ 1
V1, V2= weights assigned to Output 1 and Output 2.U1, U2= weights assigned to Input 1 and Input 2. These weights are decision variables — the Solver finds the optimal values.
5. DEA Model Formulation
Section titled “5. DEA Model Formulation”Data Envelopment Analysis (DEA) — optimization model to find efficiency scores for each facility. Run the model 9 times — once per facility. Only the objective function changes. Constraints remain the same.
| Component | Expression (for Facility k) | Explanation |
|---|---|---|
| Objective (changes per facility) | Maximize: (Yk1·V1 + Yk2·V2) ÷ (Xk1·U1 + Xk2·U2) | Maximize weighted output ÷ weighted input for the target facility k. |
| Constraint (same for all) | For each i = 1 to 9: (Yi1·V1 + Yi2·V2) ÷ (Xi1·U1 + Xi2·U2) ≤ 1 | Ensures NO facility is allowed efficiency > 1. |
| Decision Variables | V1, V2, U1, U2 | 4 unknowns. |
| Non-negativity | V1, V2, U1, U2 ≥ 0 | Weights cannot be negative. |
For each facility run: Solver finds V1, V2, U1, U2 that maximize that facility’s efficiency without letting any other facility exceed 1.
Session Summary
Section titled “Session Summary”- Problem: Measure efficiency of 9 facilities (2 inputs, 2 outputs).
- Efficiency: Output/Input, normalized so max = 1.
- Multiple I/O: Use weighted sums.
Efficiency = (V1·Y1+V2·Y2) ÷ (U1·X1+U2·X2) ≤ 1 - DEA Model: LP solved 9 times — objective changes per facility, constraints are identical.